It is impossible to predict what the stockmarket will do over any period of time. However looking at historical stock index data may give us an idea of what is possible.
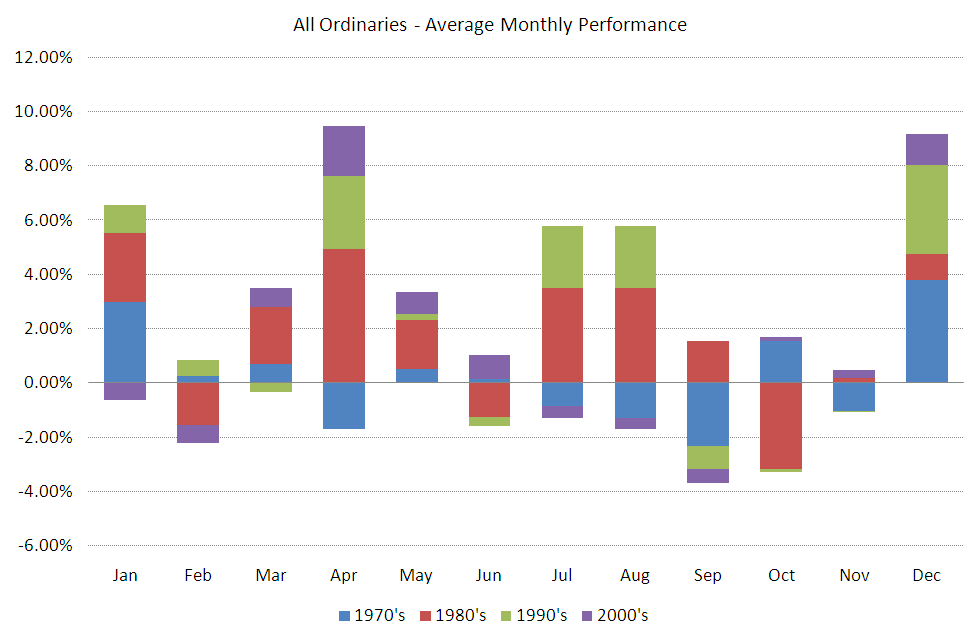
In the chart below we examine monthly moves in the Australian All Ordinaries Index over 4 decades since the 1970′s. The 2010′s was not included as we do not believe there is enough data from this decade to provide a meaningful average.
From the graph, we can see that historically September, on average, has not been a good month for investors.