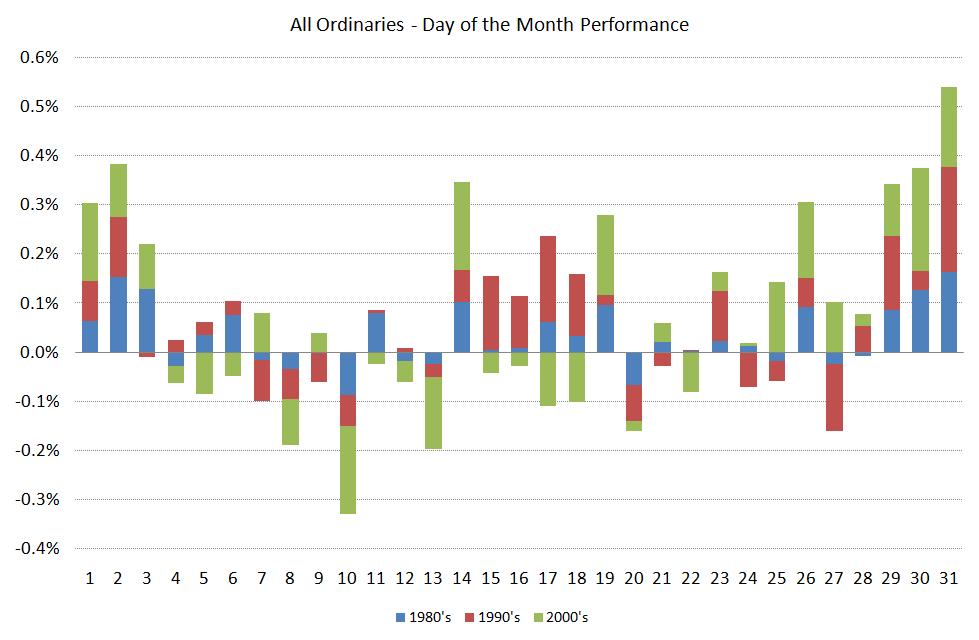
Ever wondered what day of the month was the stongest? or the weakest? In the graph below we chart the performance of the stockmarket based on the day of the month over 3 decades beginning with the 1980′s.
Historically it appears that the best days are the first 3 days of the month, the 14th to 19th, and the last 3 days of the month.
Could this be related to when money flows in to the market? Or is it just random movements.